A hydroponic ppm chart tells you how strong your nutrient solution should be for each crop. As a rule of thumb, lettuce and leafy greens run about 560–840 ppm, herbs 700–1,120 ppm, and fruiting crops like tomatoes, peppers, and cucumbers 1,400–2,450 ppm on the common 700 scale (EC 0.8–3.5 mS/cm). Because meters use different conversion factors, the most reliable approach is to read EC and use ppm only with the scale printed on your meter. The chart below uses both.
Key takeaway: Find your meter’s scale (500 or 700), start seedlings low, raise strength as plants grow, and adjust by how leaves look.
Hydroponic PPM Chart for Common Crops
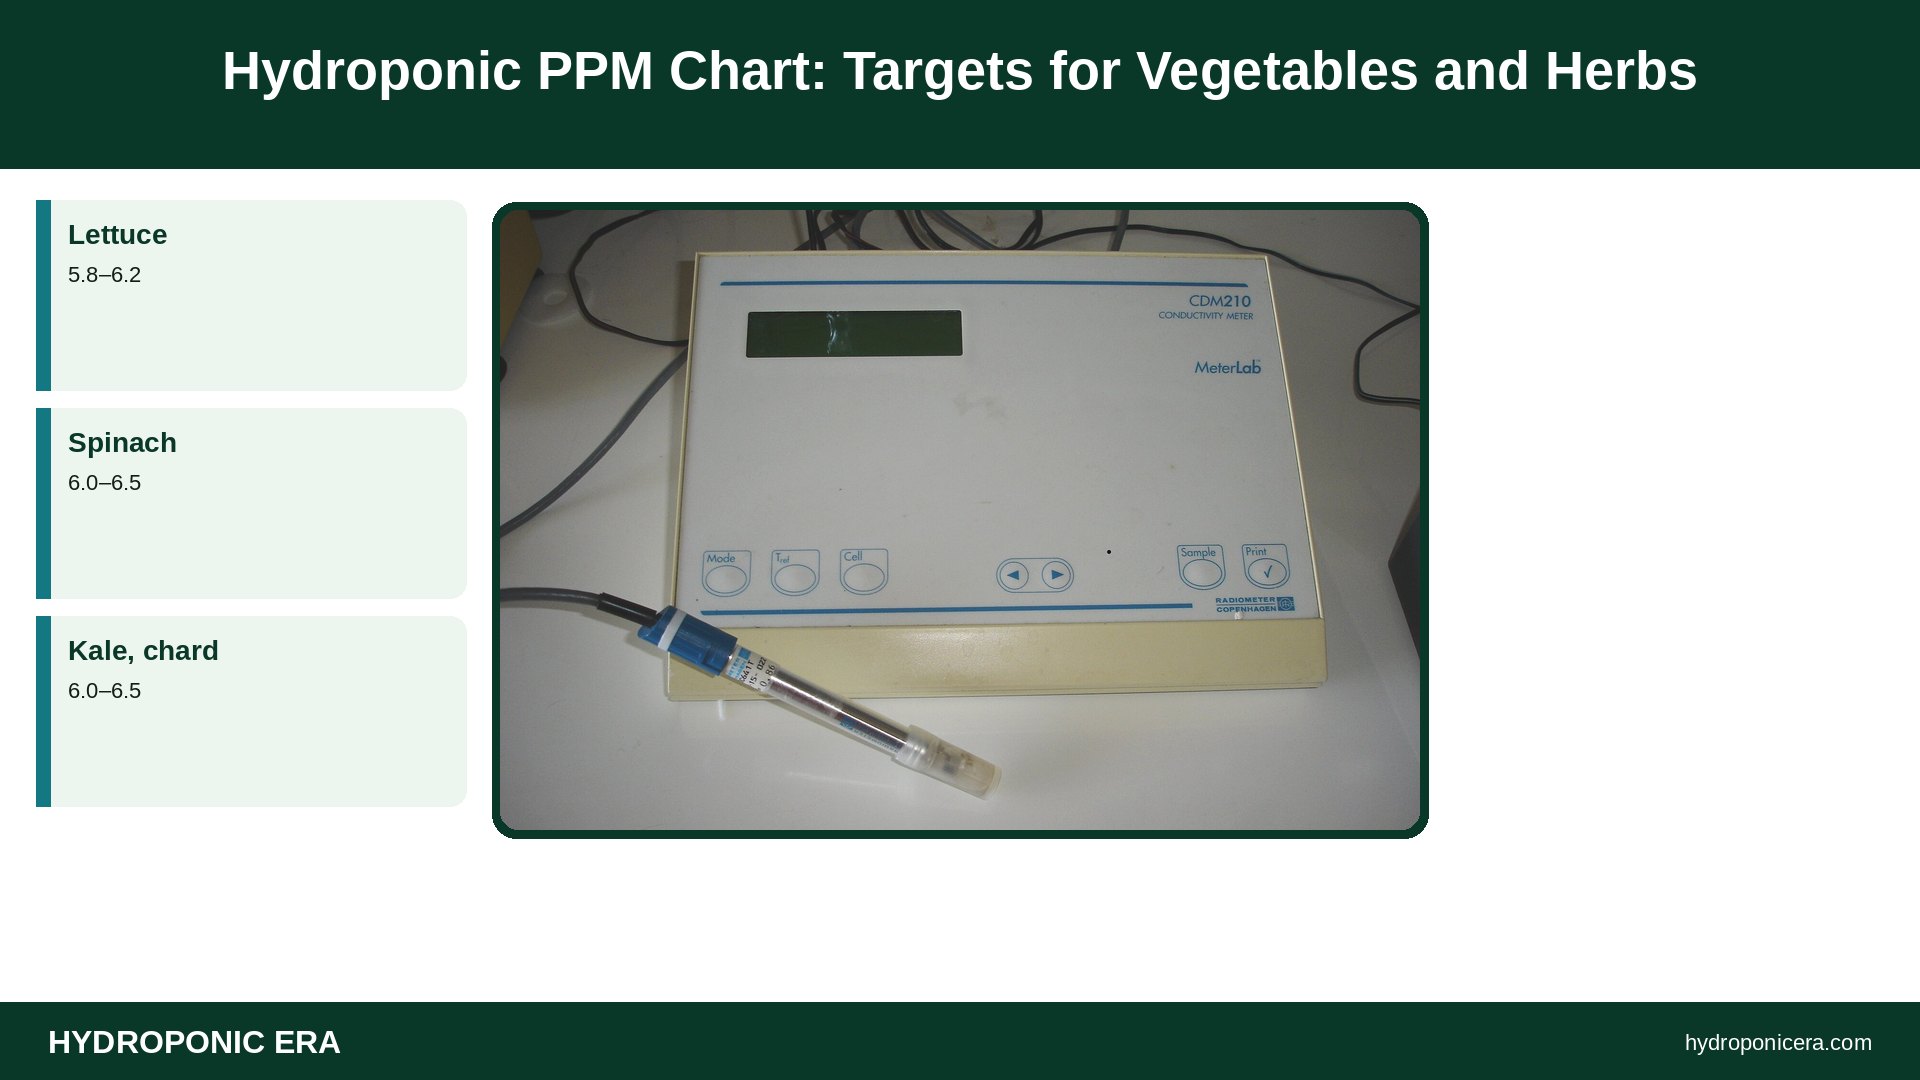
| Crop | EC (mS/cm) | PPM (500 scale) | PPM (700 scale) | pH |
|---|---|---|---|---|
| Lettuce | 0.8–1.2 | 400–600 | 560–840 | 5.8–6.2 |
| Spinach | 1.8–2.3 | 900–1,150 | 1,260–1,610 | 6.0–6.5 |
| Kale, chard | 1.2–2.0 | 600–1,000 | 840–1,400 | 6.0–6.5 |
| Basil | 1.0–1.6 | 500–800 | 700–1,120 | 5.5–6.5 |
| Mint | 2.0–2.4 | 1,000–1,200 | 1,400–1,680 | 5.5–6.0 |
| Parsley, cilantro | 0.8–1.8 | 400–900 | 560–1,260 | 5.5–6.5 |
| Strawberries | 1.0–1.5 | 500–750 | 700–1,050 | 5.5–6.2 |
| Tomatoes | 2.0–3.5 | 1,000–1,750 | 1,400–2,450 | 5.8–6.3 |
| Peppers | 1.8–2.8 | 900–1,400 | 1,260–1,960 | 5.8–6.3 |
| Cucumbers | 1.7–2.5 | 850–1,250 | 1,190–1,750 | 5.8–6.0 |
| Seedlings and clones | 0.4–0.8 | 200–400 | 280–560 | 5.8–6.2 |
These ranges combine common grower charts with extension targets. UF/IFAS lists 1.2–1.8 mS/cm for lettuce in small hydroponic systems, so many growers run a little higher than the conservative range above in cool weather.
How to Read a Hydroponic PPM Chart
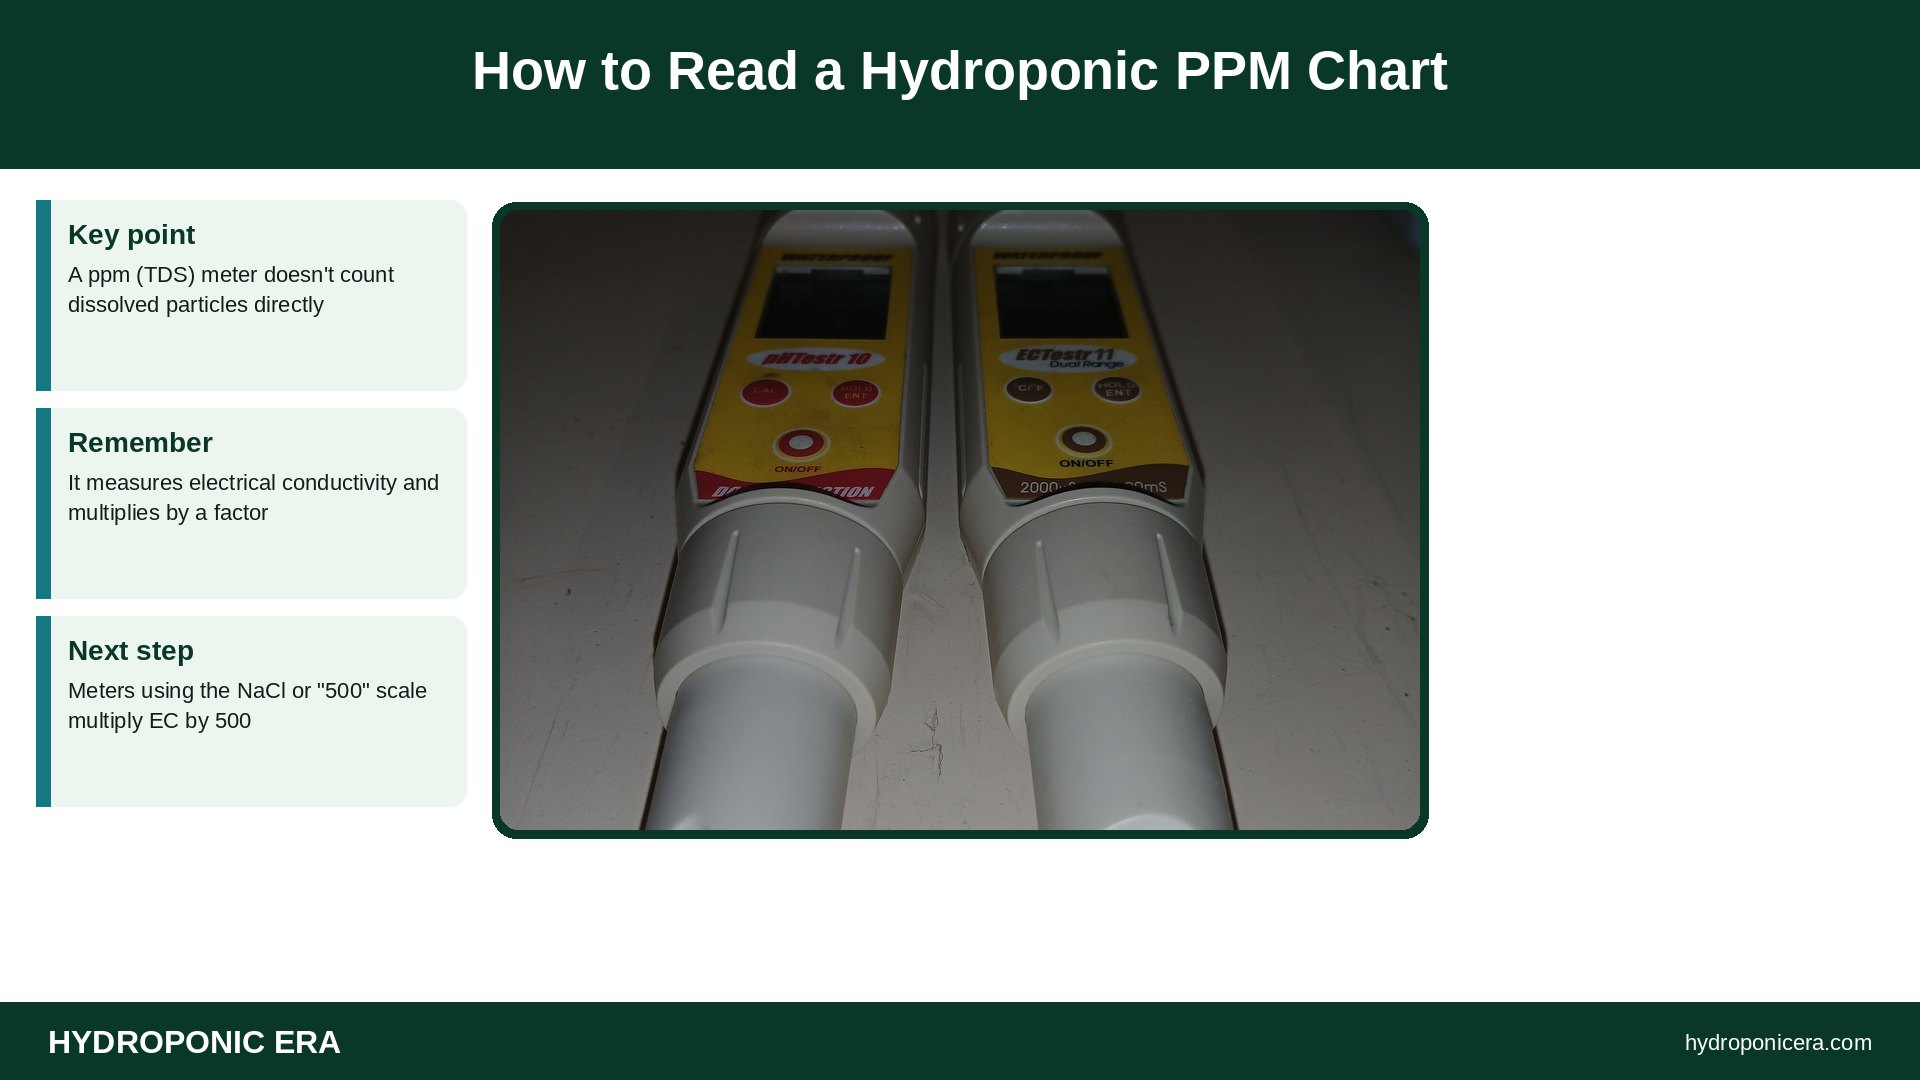
A ppm (TDS) meter doesn’t count dissolved particles directly. It measures electrical conductivity and multiplies by a factor. Meters using the NaCl or “500” scale multiply EC by 500. Meters using the “442” or “700” scale multiply by roughly 650–700. So the same solution at EC 1.6 reads 800 ppm on one meter and 1,120 ppm on another.
Always check which scale your meter uses before following any hydroponic ppm chart. If a chart doesn’t say, compare its EC column instead. See EC and TDS in hydroponics.
Adjusting PPM by Growth Stage
- Seedlings: start at about a quarter to half of the full-strength value.
- Vegetative growth: move to the middle of the crop range.
- Flowering and fruiting: tomatoes, peppers, and cucumbers move toward the high end.
- Hot weather: drop strength by 10–20% because plants drink more water than nutrients.
- Cool, cloudy weather: you can run slightly higher.
Using a Hydroponic PPM Chart With Tap Water
Your source water already has a reading. City water often reads 100–300 ppm on a 500-scale meter, and hard well water can read much higher. Measure your water before you add nutrients and subtract that baseline. Oklahoma State University Extension recommends knowing the EC of your water source for this reason.
If your baseline is very high, blend with reverse osmosis or rain water. See starting EC and source-water baseline.
Keep a printed hydroponic ppm chart near the reservoir so every reading is compared with the same target.
Signs PPM Is Too High or Too Low
| Too high | Too low |
|---|---|
| Brown, burnt leaf tips | Pale or yellow new growth |
| Dark green, stiff leaves | Slow growth |
| Wilting in a full reservoir | Lower leaves yellowing first |
| Salt crust on media | Thin stems |
For burnt tips see nutrient burn. For broader diagnosis see the nutrient deficiency chart.
Treat each hydroponic ppm chart value as a window, not a single exact number.
Reading the Trend, Not Just the Number
Daily readings tell you more than a single test. If ppm rises while the water level drops, plants are drinking more water than nutrients; top up with plain water. If ppm falls steadily, plants are feeding heavily; add a little nutrient. If it barely changes, the plants may be stressed or the roots may be unhealthy.
See EC climbing too fast and how to lower EC.
A hydroponic ppm chart lists single crops, so shared systems need a compromise value.
Mixed Crops in One Reservoir

If you grow lettuce and basil together, choose a middle value, about EC 1.2–1.4 (600–700 ppm on the 500 scale). Don’t mix lettuce with tomatoes in one reservoir; one will be overfed or underfed. See multi-crop reservoir compatibility.
No hydroponic ppm chart helps if the meter reading itself is wrong.
Calibrating Your Meter
A chart is useless with a drifting meter. Calibrate with a standard solution once a month, rinse the probe after each use, and store it dry or as the maker says. Replace cheap pen meters when readings jump around. See probe care and calibration.
A Safe Routine for Using Any Hydroponic PPM Chart
- Note your meter’s scale and calibrate it.
- Measure source water.
- Mix nutrients to the low end of the crop range.
- Check pH after mixing.
- Read ppm daily for a week and record it.
- Adjust strength by 10% at a time based on leaf color and growth.
Hydroponic PPM Chart Targets for Common Systems
The system you use also affects how strong you can run the solution. Deep water culture and Kratky systems keep roots in solution all the time, so many growers stay at the lower end of the hydroponic ppm chart. Drip systems in coco or rockwool can run a little higher because media buffers the roots, but you must watch runoff ppm. NFT channels hold a thin film of water that warms fast, so check readings more often in summer.
- Kratky and DWC: low to middle of the range.
- NFT: middle of the range; check daily in heat.
- Drip in media: middle to high; compare feed and runoff.
- Ebb and flow: middle of the range; flush media monthly.
Why a Hydroponic PPM Chart Is Only a Starting Point
Every chart is a starting point, not a rule. Plant variety, light, temperature, and humidity all change how much a plant can use. Under strong light, plants grow faster and use more nutrients. In a cool, dim room, the same strength can cause burnt tips. Watch new leaves: deep green, firm growth means the strength is right; pale new growth means feed more; crisp brown edges mean feed less. Keep notes so the next crop starts closer to its ideal number.
FAQs
What ppm should hydroponic lettuce be?
About 400–600 ppm on a 500-scale meter, or 560–840 on a 700-scale meter.
What ppm do tomatoes need?
About 1,000–1,750 ppm (500 scale) once fruiting.
Is ppm or EC better?
EC is universal; ppm depends on the meter’s conversion factor.
Why does my hydroponic ppm chart disagree with another?
They probably use different scales. Compare EC values instead.
Should I subtract tap water ppm?
Yes. Measure source water first and add nutrients on top of it.
What ppm for seedlings?
About 200–400 ppm on the 500 scale.
Sources
- Oklahoma State University Extension — Electrical Conductivity and pH Guide for Hydroponics
- UF/IFAS Extension — Growing Lettuce in Small Hydroponic Systems
- Penn State Extension — Calculating Nutrient Solution Concentrations
- Photo credits (Wikimedia Commons, edited with titles): Electrical conductivity meter by Nuno Nogueira (Nmnogueira) (CC BY-SA 2.5); PH- und Leitfähigkeitsmessgeräte by Rotkaeppchen68 (CC0); Romaine lettuce by Rainer Zenz (CC BY-SA 3.0); Hydroponic g12 by Giancarlo Dessì (CC BY-SA 3.0); Water droplets on a late cotoneaster (Cotoneaster coriaceus) leaf, Jardim da Fundação Calouste Gulbenkian, Lisbon, Portugal julesvernex2 by Jules Verne Times Two (CC BY-SA 4.0)